Background
Detecting imbalance forces in fan using vibration analysis in a cement manufacturing plant located in Ireland.
Eastway has been providing both on request and planned services to this client for many years, including vibration analysis and thermography inspections.
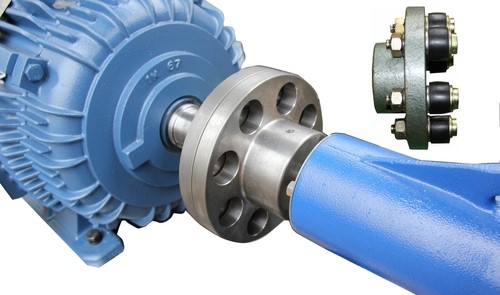
This unit set up includes one supply motor, coupling and a fan shaft and impeller. This Fan forms part of a critical process in the company.
Case Description
In-house monitoring detected high vibration values on the unit and as a precautionary measure, the maintenance staff sandblasted the fan. After the fan was cleaned, the vibration values remained high. Afterward, Eastway was called to measure the vibration on the fan and carry out a deeper analysis of the data.
Vibration readings were taken at the motor and fan test points. It was noted that the vibration was high all around the unit. See Figure 1, which displays a sample from the motor non-drive end velocity FFT spectrum (mm/s RMS) and Figure 2, from the fan non-drive end velocity FFT spectrum (mm/s RMS).

Figure 1 Motor non-drive end velocity FFT spectrum (mm/s RMS)

Figure 2. Fan non-drive end velocity FFT spectrum (mm/s RMS)
Recommended Action
After noticing the high values, the engineer immediately did a further analysis of the vibration data. As a part of this analysis, the velocity (mm/s RMS), acceleration (g RMS) and demodulation (g RMS) data were examined.
The time waveform was mainly showing a sinusoidal pattern. The waveform length was matching with the 1X Fan, approximately 25.04 Hz, see Figure 3. In addition, the velocity FFT Spectrum (mm/s RMS) was displaying 1X fan as a dominant frequency.

Figure 3. Motor non-drive end bearing time-waveform showing a sinusoidal pattern
Action Taken
Following this recommendation, Eastway was selected to carry out the fan balancing in the unit. The procedure for balancing was done in one plane. Following the recommendations for fan impeller dimensions, 36g of permanent weight was added to the blade marked as #6. See Figure 4. which is a graphical representation of the added weight on selected fan blade.

Figure 4. Graphical representation for added weight on selected fan blades
After the balancing completion, the vibration was tested across the unit and a significant reduction in vibration values were found at the motor and fan. This reduction in vibration values reached nearly 70% less vibration in some points of the machine, see Table 1. The resulting vibration levels were satisfactory in accordance with the limits recommended by ISO standards for industrial fans.

Figure 5. compares the change in velocity amplitude for the 1X on the unit for the motor non-drive end side. Red arrow indicates an amplitude of 6.108 mm/s RMS before balancing and green arrow indicates the new amplitude of 1.827 mm/s RMS after balancing was completed. The two graphs are using the same scale for easy visualisation of the change.

Figure 5. Velocity FFT spectrums (mm/s RMS) before balancing (top-sample) and after balancing (bottom-sample)
Results
Detecting imbalance forces in fan using vibration analysis, helped to prevent the premature deterioration of the fan components such as bearings, shaft, coupling, impeller, etc. In addition to identifying problems and dramatically reducing downtime, the detection also extended the life of components and allowed for maintenance work to be carried out in an efficient way.
Table 1. below displays the importance of having predictive maintenance in place to detect failures, in this case detecting imbalance forces in fan with vibration analysis, allowing corrections to be carried out before costly system failures occur.


